A beach-baked couple beat me into Togo’s a few weeks ago. The sandwich maker, a 20-something fellow who was gloomily plopping mayonnaise onto bread, muttered hello.
“We’re great. We’re in Santa Cruz,” the man chirped. “But I’m not doing as well as you are, I’m sure, you live here.”
Sandwich dude looked up, managed a polite nod, and returned to the mayo.
An oblivious interaction, yes, but perhaps the man was on to something—many folks assume seaside spots such as Santa Cruz harbor the secret source of glee.
I know I’m happier here than in my most recent residence, a strange structure surrounded by megamansions in a Bay Area suburb. But are others? Has anyone looked into this?
Contentment has been on my mind since I savored Eric Weiner’s stellar book, “The Geography of Bliss: One Grump’s Search for the Happiest Places in the World,” earlier this year. Just pages in, I pleasantly discovered that pondering happiness is hip.
In fact, it’s a booming specialty, replete with jargon — those in the know call it “subjective well-being” — a journal, massive databases and slews of scholars.
So post-sandwich, I put my SWB savvy to the test with an online search. I quickly confirmed my assumption: the sunburnt day-tripper was not the first to link Santa Cruz and happiness.
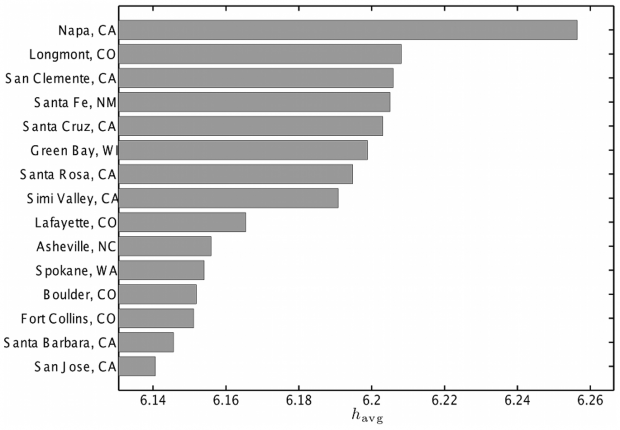
It’s actually the nation’s fifth happiest city, according to a study based on geotagged tweets released May 29 in PLOS ONE.
Santa Cruz sits behind top-ranking Napa, where folks really do tweet the word “wine” more often, in case you were wondering.
“The Geography of Happiness: Connecting Twitter Sentiment and Expression, Demographics, and Objective Characteristics of Place” is one of a series of analyses by a University of Vermont research group called the Computational Story Lab, where primary author Lewis Mitchell, a mathematician, is a postdoc.
Mitchell specializes in climate models and at first it struck me, a mathematical mortal, as quite a jump from climate to happiness analysis. But the link, I learned, is complexity. Appropriately, the lab is part of the Vermont Complex Systems Center.
In order to pin down the complexity (and perhaps to explain their own moods), lab members created the hedonometer in 2011. I initially missed the importance of the hedonometer as Mitchell refers to it only briefly. I later realized, however, it provides the key underpinning to his entire study. (As a quick refresher, 19th century economist Francis Edgeworth coined the term “hedonimeter” to describe a theoretical machine that could “continually register(s) the height of pleasure experienced by an individual.”)
A tool and toy, the site extracts individual words from Twitter’s “Garden Hose” feed, a real-time stream of 10 percent of all tweets, approximately 50 million a day. The hedonometer plucks words it recognizes — it has a 10,000-word vocabulary, for more, see FAQ — and crunches their “happiness” values, calculating a daily happiness score.
Researchers paid users of Amazon’s Mechanical Turk crowdsourcing service to rate the words on a scale of 1 (sad) to 9 (happy). For example, “rainbow” soars at 8.1, while “earthquake” strikes only 1.9. Words go in the hedonometer and — voilá — searchable happiness data pops out the other end.
Santa Cruz is happy, then, because the hedonometer says so, at least based on the 10 million geotagged tweets from 2011 Mitchell used in his study.
And that tenuous but tantalizing logic just requires too many leaps. I can tweet “Happy Mother’s Day” to my mom while sobbing hysterically, for example. (And, fyi, the hedonometer’s happiness score spiked on Mother’s Day thanks to the millions of tweets containing the word “happy.”)
In this paper and others, lab members acknowledge many of the hedonometer’s limitations. Many people don’t tweet and those who do tend to be younger. A few people tweet all the time — perhaps Santa Cruz has several very, very happy people. Many important emotions aren’t tweeted (who wants to read, “I’m happy” tweets?) Geotagged tweets, importantly, don’t necessarily stem from local residents. And, the words are taken out of context.
Yet for most of these limitations, the researchers have one answer: with enough data — millions and millions of words — statistical models can outthink outliers and hone in on the data’s true trends.
To explain, Mitchell reaches back to his weather work. To take the temperature of a room, an average, thermometers need access to many particles, not just one.
Their Twitter-based analysis largely accorded with traditional survey-based techniques, the authors concluded. They compared results with the 2011 Gallup-Healthways Well-Being Index, which assesses the overall vitality of 500 Americans each day using 56 questions addressing emotional and physical health, behaviors and other factors. For example, by survey, Boulder, Colo. is the fifth happiest city and using tweets, it ranked No. 12. And, Lewis et al. noted, their method was “far more efficient.”
The team also lined up their data against census information, finding higher socioeconomic status — as measured by indicators such as advanced degrees — generally correlated with tweet-based happiness.
Then they started playing: juxtaposing word use with census attributes. And this, I’ll bet, was fun. College grads tweet “café,” “yoga” and “forest” more often (and, shocker — “library” and “university” as well). The non-obese spend time tweeting “sushi,” “banana,” and “cuisine” to their buds, and, sadly, the obese tweet “heartburn,” “mcdonalds” and wings.
I could go on.
I’m not completely sold, but I’m interested — enough to the follow the Computational Story Lab’s bliss-probing work — and definitely entertained.
Yet happiness — that intangible, sought-after something — is much more than computational models and tweets and happiness-rated words.
So far, scholars know the formula for real happiness includes friends and family, trust, gratitude and just enough money. It lacks jealousy and is soured by excessive rumination. And, as Weiner, the author who started me on this whole adventure, stated, “beaches are optional.”
The 15 highest average word happiness scores out of 373 cities in the contiguous USA
Scale: 1 = sad; 9 = happy
Source: “The Geography of Happiness,” Mitchell et al., 2013


Comments are closed.